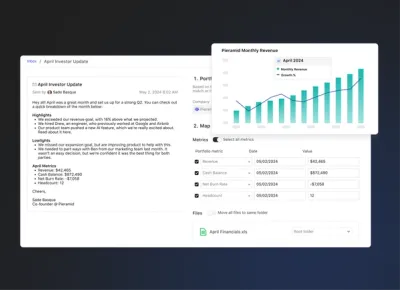
We quietly launched some awesome updates to Visible last week that we wanted to make sure got the attention they deserve. The two updates below focus on automation of your KPIs and enhancing the storytelling of your data.
Zapier Integration
Our integration with Zapier is now live! It is in beta so you’ll have to use this link to accept the invite to Zapier.
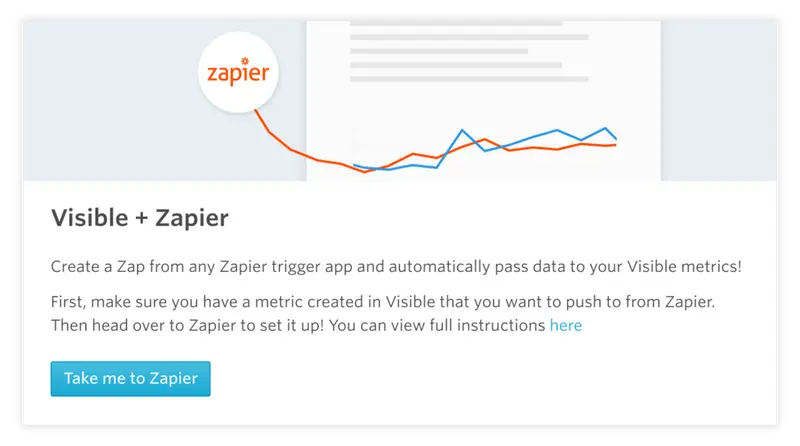
Link any trigger apps and assign values to your Metrics in Visible. E.g. Every time a new trial of our “Pro” account is started in Stripe I have that add +1 to our Pro Trials Created metric within Visible.
You can find more info in our knowledge base. Feel free to reach out with any questions or recipes that you love!
Update Enhancements
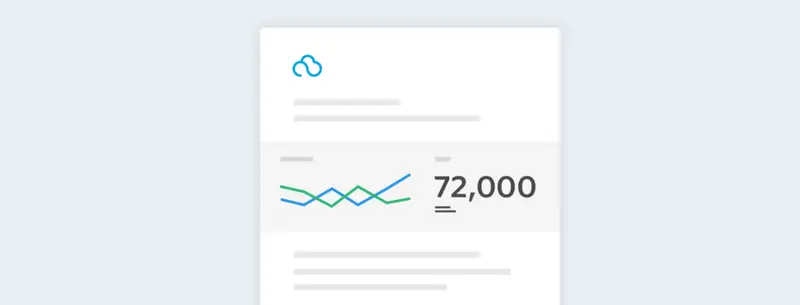
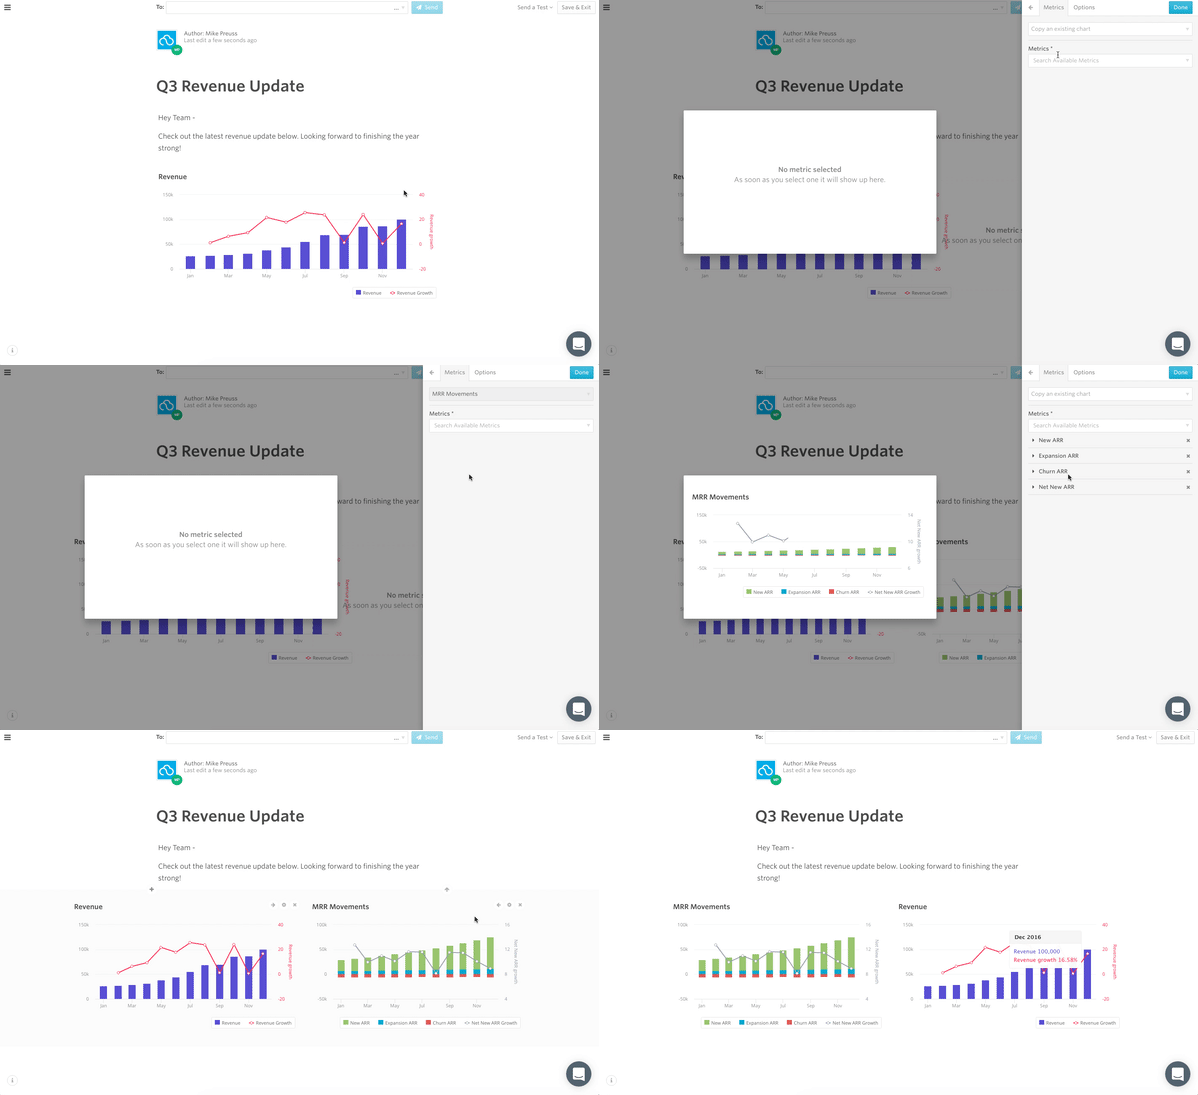
You can now do two commonly requested actions within an Update. 1) Include bold number visualize types and 2) Include 2 charts side by side in an Update similar to a dashboard.
In an Update simply hover over a chart component and click the grid icon to add a secondary chart. You can click the arrow to re-arrange the position as well.
We hope you enjoy these updates! Stay tuned for more exciting announcements in the near future!
Up & to the right,
-The Visible Team
