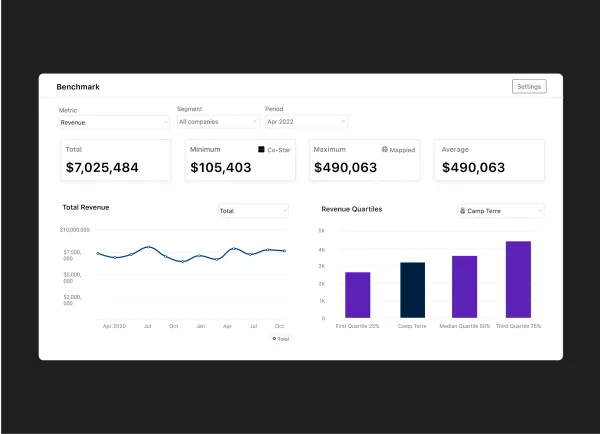
Product update: Introducing Visible Portfolio Metric Dashboards

Matt Preuss
Marketing Manager
Quartiles
Take the next steps with Visible.
Request a Demo
Understanding the performance and impact of your portfolio is critical for decision-making, follow-on investments, and raising future funds.
Available today, portfolio metric dashboards will give investors instant insights into portfolio company operational performance.
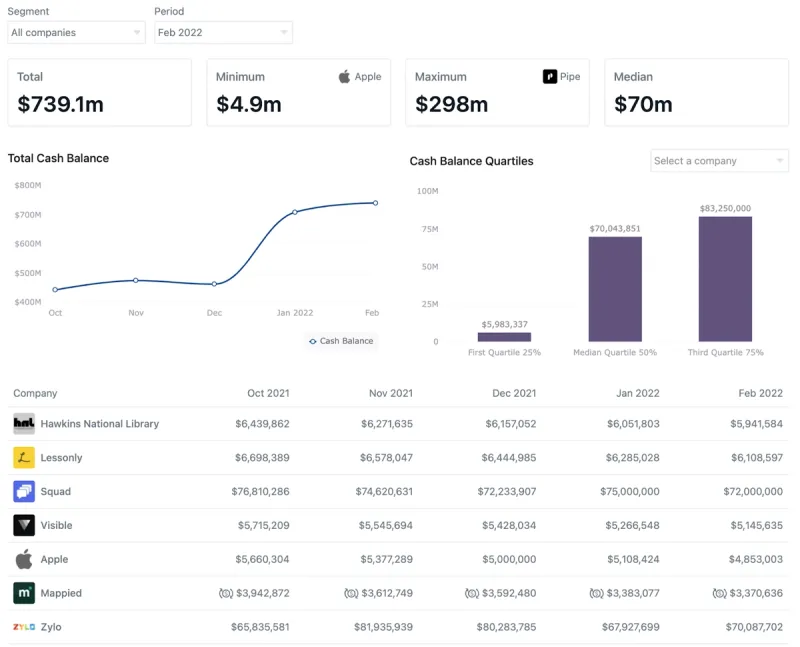
Visible will automatically provide investors the following:
- Total – The total sum for a given metric included a time series trend chart
- Minimum – The minimum value and respective company
- Maximum – The maximum value and respective company
- First Quartile 25%
- Median Quartile 50%
- Third Quartile 75%
Investors will also be able to view benchmark data for any current portfolio segments or for a particular period.
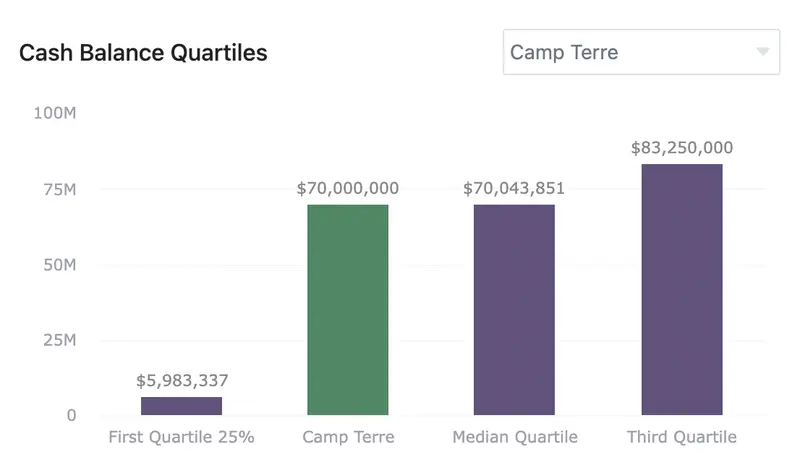
Quartiles
Investors can also select any portfolio company to quickly view their performance relative to the respective portfolios.
As always let us know if you have any questions or feedback!
Up & to the right,
Mike
View more categories:
You may also enjoy:
Metrics and data
Breaking Down High Alpha's 2024 SaaS Benchmarks
High Alpha, in partnership with OpenView, teamed up to explore pricing models, churn, AI adoption, financial performance, and more in the 2024 SaaS Benchmarks Report.
Mike Fitzgerald and Blake Koriath of High Alpha joined us to dive into the report, highlighting key trends, data points, and themes.
A couple of key areas we hit on:
The makeup of the report
Market stabilization and expectations in today's market vs. previous years
Vertical vs. Horizontal SaaS performance
Why GTM execution is keeping founders up at night
How companies are balancing burn and growth
And much more
Download the full report to uncover other trends and benchmarks below:

Product Updates
Shaping the Future: Unveiling Our Brand Refresh
Product Updates
Product Update: Turn Emails Into Insights With Visible AI Inbox

Customer Stories
Case Study: Airtree Venture's Transformation with Visible